By Jesse Walton, Jay Hindmarsh and Anne Schopf
Following the historic 1997 Kyoto Protocol, and the growing understanding of the role that the built environment has on global warming, Mahlum began in earnest to incorporate sustainable strategies into our work. That early commitment resulted in the firm being awarded two national AIA COTE Top Ten Awards for The Evergreen State College’s Seminar II Building (2005) and Lake Washington School District’s Benjamin Franklin Elementary School (2006). In addition, Mahlum’s Providence Newberg Medical Center became the first LEED Gold Certified Hospital in the nation (2007). All these projects looked to low energy solutions, including natural ventilation strategies for summer comfort.
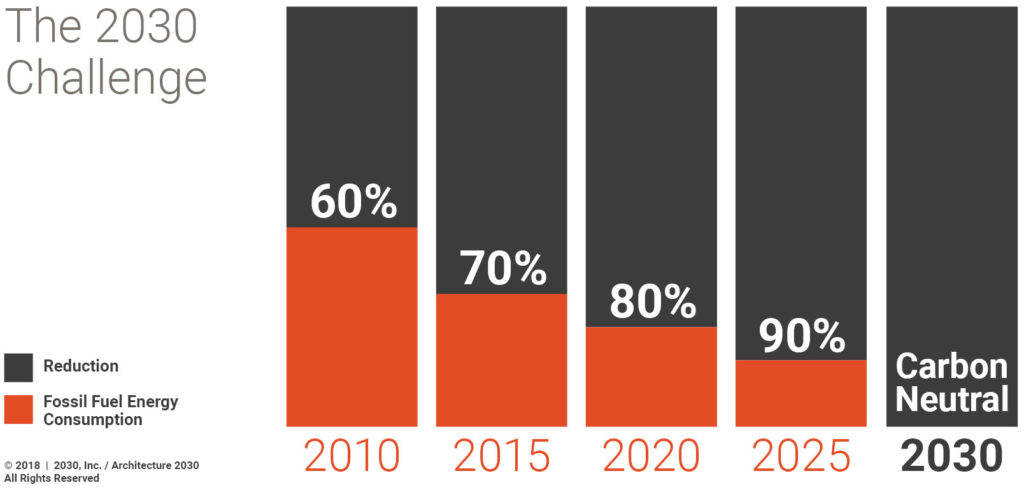
Our commitment to a low-energy future deepened on May 8th, 2009 when we signed onto the newly created AIA 2030 Commitment. Mahlum made this ambitious public commitment to prioritize energy performance in pursuit of carbon neutral buildings by the year 2030 in alignment with Ed Mazria’s 2030 Challenge.
At that time the year 2030 was more than 20 years in the future and while the commitment we had signed seemed daunting, at the time we had no idea (1) how far away we were from a carbon neutral future, and (2) how to accomplish the goal. Now that we are deep into 2020 and less than 10 years away from the 2030 goal of carbon neutral buildings, we are all too aware of the actual time, dedication and means it will take to achieve this goal.
2009-2014
For the first five years after we signed onto the 2030 Commitment we struggled with two things. The first was the creation of our Sustainability Action Plan (SAP) which was intended to be a publicly shared document outlining the firm’s culture of sustainable design and operations. We formed various committees and circulated drafts, but with the devastation of the recession, the document sat on our server in draft form, remaining incomplete.
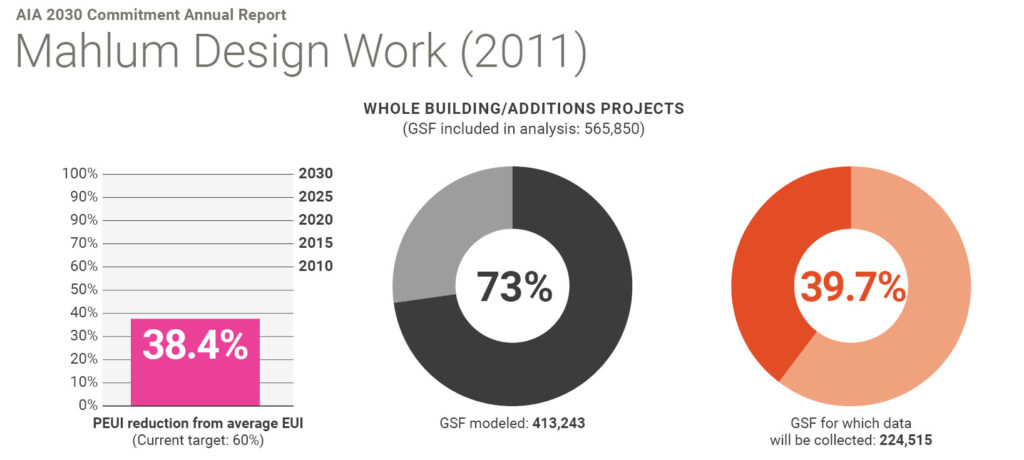
The second struggle was how to collect every project’s predicted Energy Use Intensity (pEUI) and what form it should take. Most of our projects at the time did not have a pEUI or a person on the team who could run an energy model to calculate the pEUI. When it was possible, we leaned on our mechanical engineers to calculate each project’s pEUI. We also asked project teams to focus on collecting the pEUI data into Access Databases and Excel Spreadsheets, which we then submitted to the AIA annually. By gathering this information, we learned that though we were reducing our average pEUI, we were not actually meeting the current target of 60%. Though disappointing, at least this data collection effort kept us honest about where we stood.
Below is our first pEUI Reduction Percentage Report to the AIA in 2011:
2015-2019
A renewed interest in finalizing our firm’s SAP arose and we formed the Sustainability Steering Committee (SSC), a group of architectural staff, including leadership, who met regularly and focused on the firm-wide integration of sustainable design. The SSC, with input from the entire office, took two years to finalize and publish our SAP.
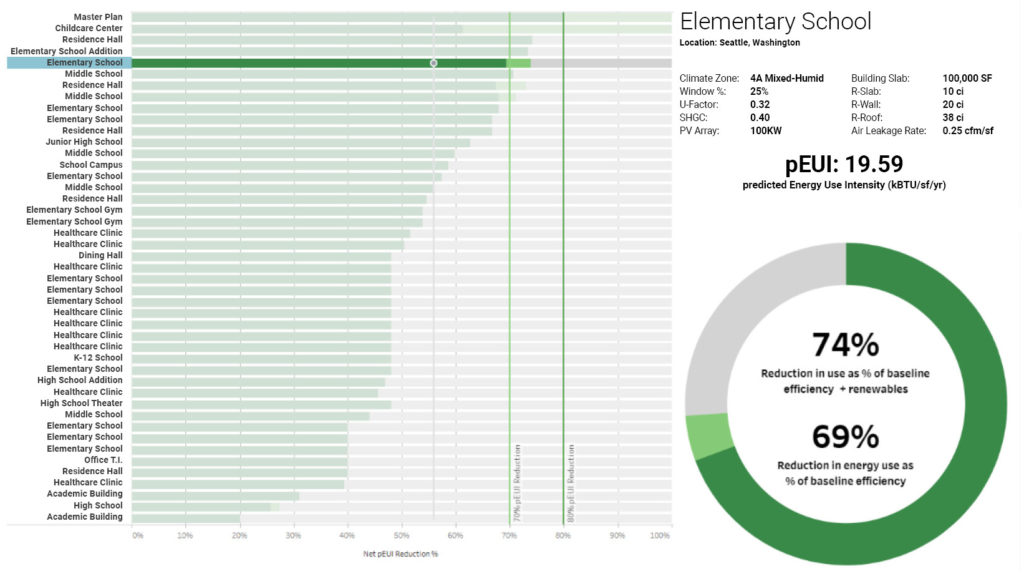
In 2015 the AIA created the 2030 Design Data Exchange (DDx), an online database of all AIA 2030 Commitment signatories’ projects and their related pEUI data. This helped regularize the type of data collected and the location to collect it in. Through trial and error, we also learned that each team needed support to collect the pEUI data for the DDx on an annual basis, so we formed the 2030 Birddogs. This small group of architectural staff (around six participants), distributed between our Portland and Seattle offices and our Healthcare, Housing, and K-12 studios, partnered with each team to make sure the data submitted to the DDx was accurate and complete. In addition, during our office’s bi-annual project check-in with leadership we asked project teams to update an Energy Use Intensity Speedometer which built in accountability for the pEUI regularly, as shown below.
Where are We Now?
2020
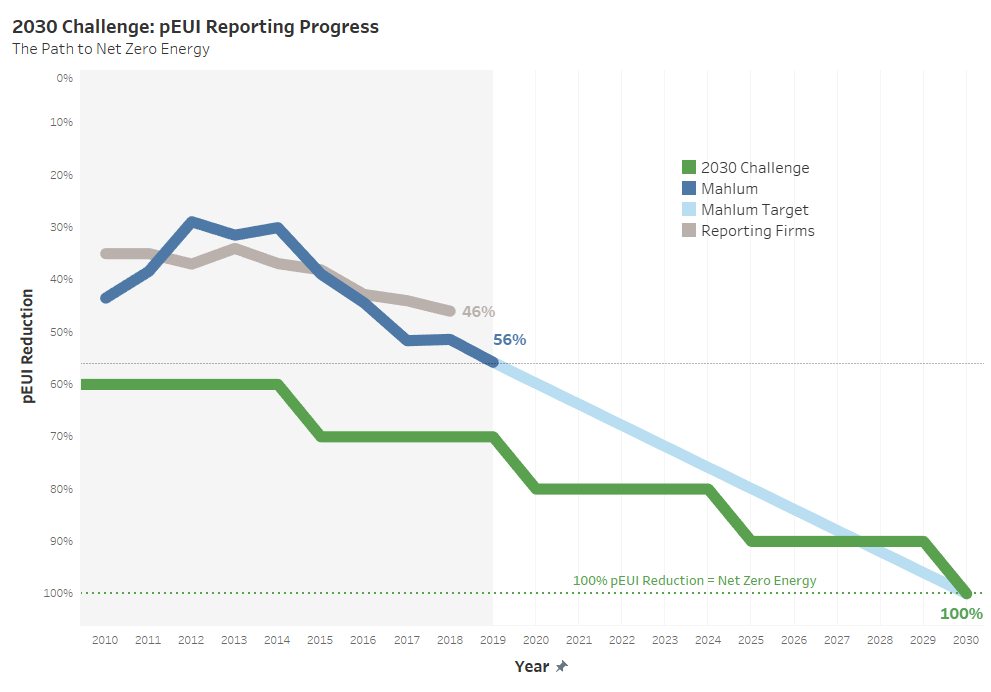
After 9 years of consistent pEUI data collection and using new tools like Tableau Public to better understand this data, we now have a detailed understanding of where we are in relation to the 2030 goal of carbon neutral buildings. Since 2013 we have annually increased our energy efficiency 4%, and since 2017 we have had an energy efficiency of greater than 50% – achieving a higher pEUI savings than the average AIA 2030 Commitment reporting firm. In 2019 our project’s pEUI savings was 56%. While this did not meet the 70% energy efficiency goal in 2019, if we extrapolate our historical improvements of 4% annually it is realistic that we can achieve 100% energy efficiency by 2030.
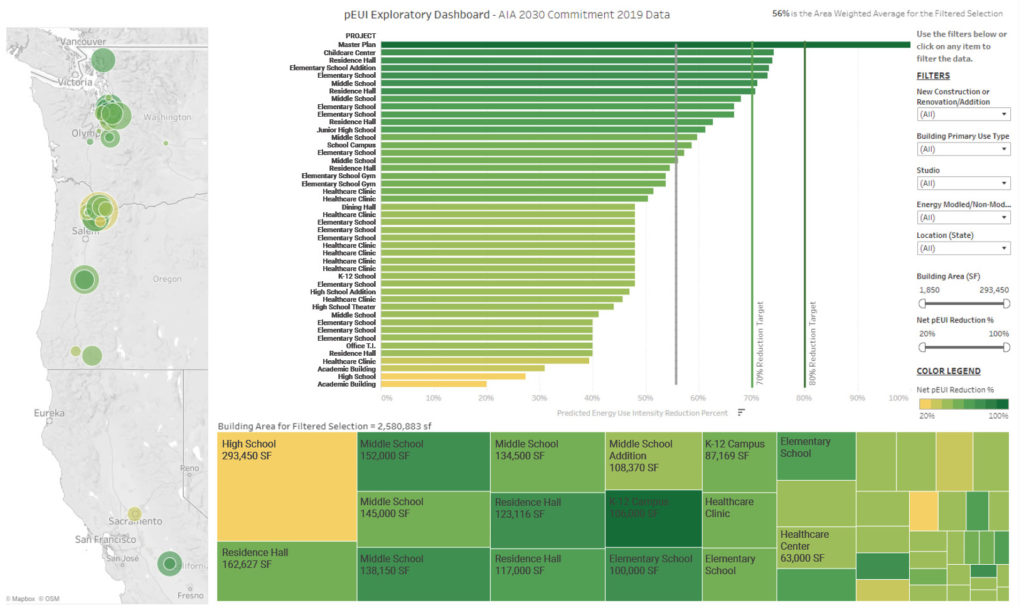
In 2020 we decided to analyze the 2019 pEUI data using Tableau Public. We created an interactive data visualization and found several compelling findings that highlighted some correlations and differences outlined in the 2018 Summary Report of the AIA 2030 Commitment, which currently represents the national average from reporting firms.
- We found that our new construction work was 19% more energy efficient than the national average while our renovation work was 19% less efficient than our new construction work. For example, Mahlum’s renovation work at a 45% reduction aligns with the 2018 report, but our new construction work at 64% is 19% more energy efficient than both our renovation work and the national average for new construction work.
- Our K-12 and Higher Ed work at a 55% reduction was slightly better than the 53% reduction in the 2018 Report. Our healthcare work at 48% reduction was on par with the Healthcare work in the 2018 Report, but 7% less efficient than our K-12 and Higher Ed work.
- Our energy modeled projects had a 58% reduction whereas our projects that were not energy modeled had a 42% reduction, a 16% delta. The 2018 Report notes a 25% delta between the two, a larger discrepancy between energy modeled and non-energy modeled projects.
- Our projects in Washington State have an average 62% reduction, while our Oregon work is a lower 46% reduction – a 16% delta. Our 2019 Washington State work was designed under the 2015 IECC with Washington State Amendments, which aligns with ASHRAE 90.1-2013 energy efficiencies. Our 2019 Oregon State work aligns with the 2014 OEESC and ASHRAE 90.1-2007 energy efficiencies. The National Impact of ASHRAE 90.1-2016 Report notes that the difference between 2007 and 2013 versions of 90.1 is 14%, making it close to the 16% difference we are seeing between our work in Washington and Oregon. With the new Oregon 2019 Zero Energy Ready Commercial Code implemented at the end of 2019 we expect to see our new Oregon projects in 2020 align with the energy efficiencies we have been seeing in Washington State for the past three years.
Below: Our pEUI Exploratory Dashboard for AIA 2030 Commitment 2019 Data created in Tableau Public.
How We Get to Carbon Neutral and Achieve the 2030 Challenge
- Focus on Renovation work. Even though our New Construction Work is performing significantly better, we will need to focus our efforts on renovation work to bring it up to the same energy efficiency levels as our new construction work.
- Energy Model all projects. Considering our energy modeled work is performing 16% better than our non-modeled work, we will advocate for all projects to use energy models during design to continue to build energy efficiency awareness.
- Focus on our lower efficiency Healthcare work. Since our Healthcare work is 7% less energy efficient than our other market sectors, we will need to transfer some of the energy efficiency strategies from our higher performing K-12 and Higher Ed work to our Healthcare work.
- Implement Washington State efficiency standards into our Oregon projects. With the new Oregon Zero Energy Ready Codes now in effect in 2020 we will take the lessons we learned complying with the Washington State energy codes to our Oregon work including continuous insulation above and below grade, reduction in thermal bridging, and tight air barriers. Now that the two state’s codes are more closely aligned, the efficiency of our Oregon projects should increase by 14%-16%.
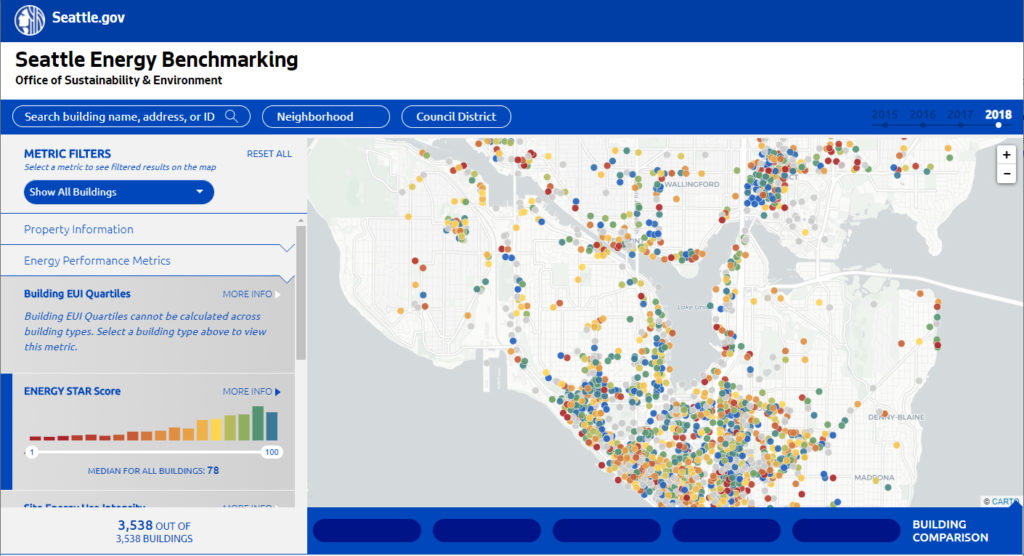
- Measure & Collect Actual Energy Use Intensity (EUI). With inspirational efforts like the Seattle Energy Benchmarking Program which requires the public disclosure of EUI for buildings over 20,000sf on an interactive online map we have started to collect our own projects EUI to see if they align with our predictions during design.
- The Addition of PVs. The few projects we have to date that meet the 70% and 80% reduction targets of the 2030 challenge are really Net Zero Energy Ready, meaning that with a large PV Array they can achieve 100% net energy reduction aka Net Zero Energy. Most of our work at Mahlum is low rise construction and can handle large PV arrays on the roof, or Community Solar must be integrated to achieve Net Zero Energy.
- Embodied Carbon. The AIA 2030 Commitment signatories have been dedicated to focusing on operational energy and carbon impacts. Now that our buildings are more typically seeing high energy efficiencies it is even more important for us to focus on the embodied carbon and its impact on our climate – but that is for another post.
To 2030 and Beyond!
In the mid 90’s we started our sustainability journey with a handful of project specific goals to achieve LEED certification. Those goals have since snowballed into a firm-wide effort of accountability to our planet with the implementation of energy-efficiency and low-carbon goals into all our work. In 2020 we now have measurable data that shows us where we are in relation to the goals of the 2030 Challenge, and how much further we must go to get there.
When considering the daunting task in front of us we, as architects more aware than most of how distant carbon neutrality is, must remember the words Greta Thunberg spoke in September 2019, “You must take action. You must do the impossible, because giving up can never be an option.”